
Golden Software has added the ability to download georeferenced Google aerial and satellite images to map projects in the latest version of its Surfer mapping and 3D visualization package. Other new features focus on faster and simpler creation of 3D visualizations that are easier to interpret and understand.
“The ability to easily download reliably high-quality basemap images from Google Maps adds a rich layer of information that puts a mapping project in its proper geographic context,” said Surfer Project Manager, Kari Dickenson. “Surfer users will find they can communicate their work more accurately and vividly with the latest software version.”
Surfer is used by more than 100,000 people worldwide, many involved in environmental consulting, water resources, engineering, mining, oil & gas exploration, and geospatial projects. The software has been relied upon for more than 40 years by users in numerous disciplines to quickly transform complex data into superior 2D and 3D visuals with accuracy.
Known for its fast and powerful contouring algorithms that regularly outperform more expensive packages, Surfer enables users to model data sets, apply an array of advanced analytics tools, and visually communicate the results in a way that even the non-technical stakeholders can understand.
The following upgrades have been made in the latest release of Surfer and are available today:
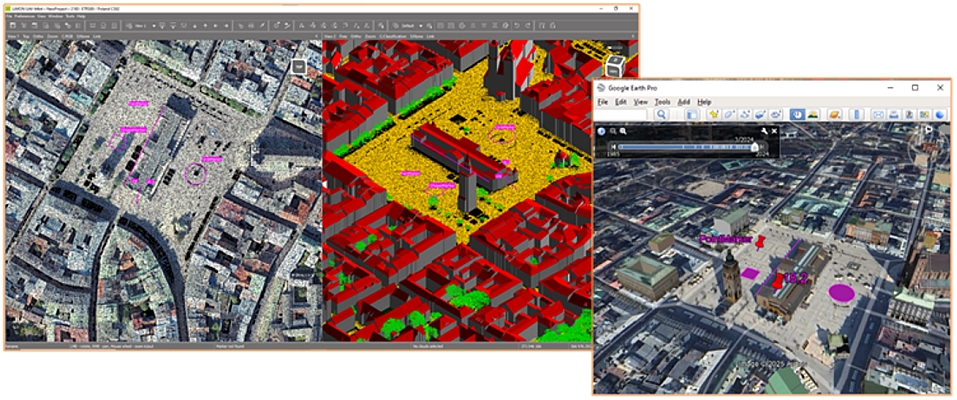
Direct Google Maps Access – The Base from Server command now gives users online access to global maps and aerial/satellite images from Google Maps for download directly into their Surfer projects as georeferenced base maps. This has eliminated the time-consuming and frustrating task of searching multiple online servers to find compatible basemaps, or manually georeferencing screenshots from Google Earth.
Colorized 3D Drillhole Intervals Based on Keywords – Users can now use text keywords, such as “Limestone” or “Granite” to colorize the intervals in their 3D drillholes, making it easier to visualize stratigraphy, mineralization content, or formations. Surfer automatically generates a legend showing the colors and keywords, greatly speeding the model-making process.
Linked Text – Users can now link objects to text data, such as the filename, file path, date/time, or the contents of a cell in an Excel spreadsheet. A refresh button lets users easily update the text by inserting the latest edits and new information into text blocks and figures, ensuring the map is always up to date with data that is easy to retrieve.
Surfer Beta Available
As is tradition, Golden Software has released a Beta version of Surfer simultaneously with the new version to give customers a chance to try out new features and provide feedback while they are still in development. Users may find the Beta version by clicking File | Online | Try Beta Version from within Surfer.
“In the Beta features now under development, we continue to make the 3D visualization capabilities more robust and easier to use in Surfer with the goal of saving time and reducing headaches,” said Dickenson.
The new Beta features in Surfer fall under two categories: 3D Viewing and Legends.
3D Viewing:
- Create, Edit and Export Contact Points in Drillholes – With criteria defined by the user to identify different contacts in drillholes, such as lithologic formation, mineralization zones, or time horizons, Surfer automatically finds and places points at the contact between the units. The user can edit the points as needed and then export them for gridding and creation of a new surface that can be viewed in 3D. For users with dozens or hundreds of drillholes, this is an enormous time saver.
- Multiple Light Sources – 3D View now offers up to four different lighting directions so that drillholes and surfaces in varying, and even perpendicular, orientations can be fully illuminated for effective viewing.
Legends with Unique Values – Once an inflexible feature that compelled many users to spend time creating Legends from scratch, Surfer can now automatically generate Legends with the appearance, content, and alignment desired by the user. There are seven new Legend functions:
- Create names for unique value attributes,
- Display only the properties that are applied in the layer,
- Change the size of the line sample in the legend,
- Change the size of the symbol sample in the legend,
- Set alignment of samples as left, center, or right,
- Put the line style around a polygon fill sample,
- Separate attribute samples, such as polylines and polygons, into different rows.