Data collected by the ESA’s Gravity Field and Steady-State Ocean Circulation Explorer (GOCE) has helped scientists produce what they are calling the most accurate gravity maps of global ocean currents ever.
GOCE, which was operational from 2009 through 2013, was used to provide extremely precise measurements of the Earth’s gravitational field. Scientists received the final data package from the mission four months ago, and presented some of their findings (including the new map) this week at a conference at the UNESCO headquarters in Paris.

According to BBC News science correspondent Jonathan Amos, the new model will be useful to climate scientists because the circulation of ocean water helps transport heat around the world. GOCE’s instruments could detect very subtle changes in gravity, and using that information, the team was able to develop a “geoid” or a depiction of the “level surface” on a perfect world.
In reality, gravitational pull varies from place to place due to the uneven distribution of mass inside the planet, Amos explained. However, a “geoid” depicts the shape the oceans would take if they were not disturbed by winds, currents or tides. By comparing this model to measurements of sea-surface height made by other spacecraft, the researchers are able to determine where water started piling up.
Furthermore, as Patrick J. Kiger of Discovery News noted, using simulations of the Earth’s oceans at rest allows scientists to better observe the impact of gravity on ocean currents. Under real-life conditions, the relationship between gravity and currents is more difficult to accurately chart due to the influence of other forces (such as wind), which causes those ocean currents to deviate from the patterns established by gravity.
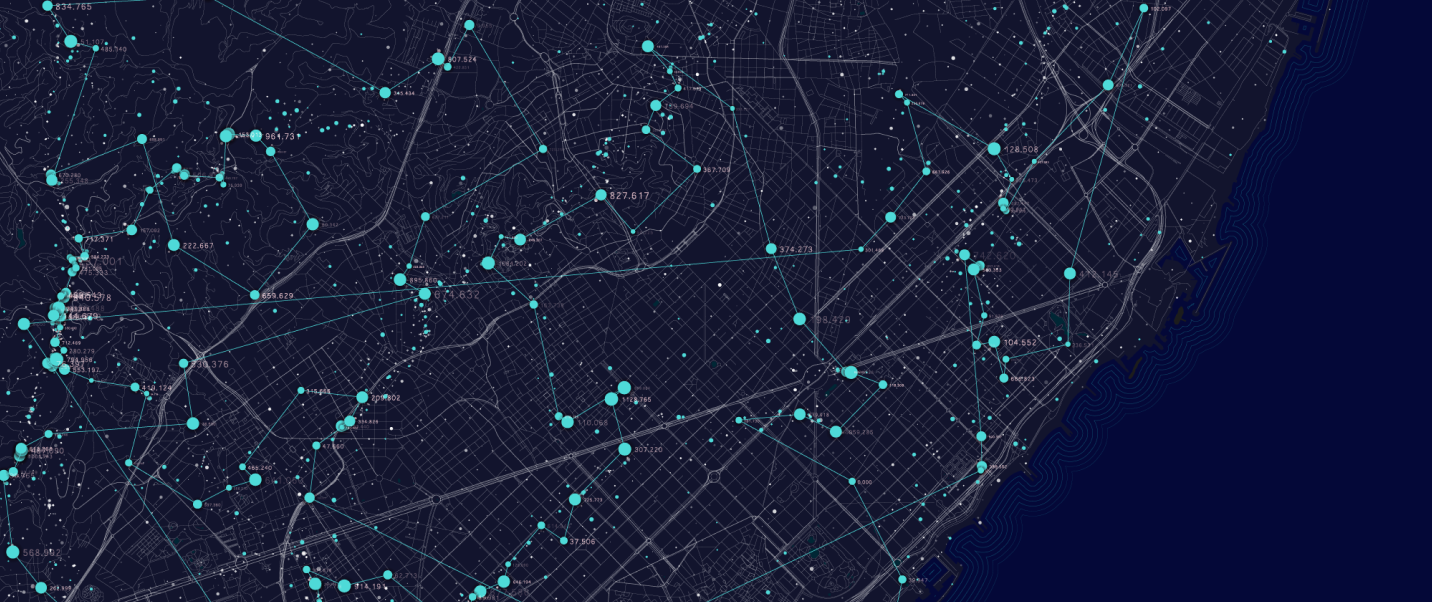
“Clearly visible in the map at the top of this page are the Agulhas Current flowing down the African coast; the Gulf Stream running across the Atlantic; the Kuroshio Current that sweeps south of Japan and out into the North Pacific; as well as the Antarctic Circumpolar Current, and the system of currents that hug the Equator,” the BBC News writer said. “In places, these great trains of water move in excess of 1m per second.”
The geoid is also described in a new study from researchers at the University of Bonn Institute of Geodesy and Geoinformation, the Graz University of Technology Institute of Theoretical Geodesy and Satellite Geodesy, the Space Research Institute at the Austrian Academy of Sciences, and the Institute for Astronomical and Physical Geodesy at Technische Universität München. That paper appears in the November 25 online edition of the journal Geophysical Research Letters.
“The new GOCE model of ocean circulation has been checked and integrated with the point measurements from drifting buoys. This has helped capture some of the smaller-scale features in the currents that lie beyond the capabilities of satellites, even one that made as highly resolved observations as the ESA mission,” said Amos.
“Scientists can now add in data collected about sea temperature to calculate the amount of energy the oceans move around the Earth. Computer models that try to forecast future climate behavior have to incorporate such details if they are to run more realistic simulations,” he continued, noting that “many other applications” could use GOCE data, including those monitoring Antarctic ice loss or the deep-Earth movements responsible for earthquakes.
Source: Red Orbit