
 ENVI software is known for its powerful geospatial image analysis tools, but now the latest release of the software adds significant LiDAR point cloud analysis and visualization capabilities – capabilities that previously were only available in the ENVI LiDAR software package. The new and improved ENVI offers users a single software interface to work with hyper-spectral, multi-spectral, panchromatic, and LiDAR data.
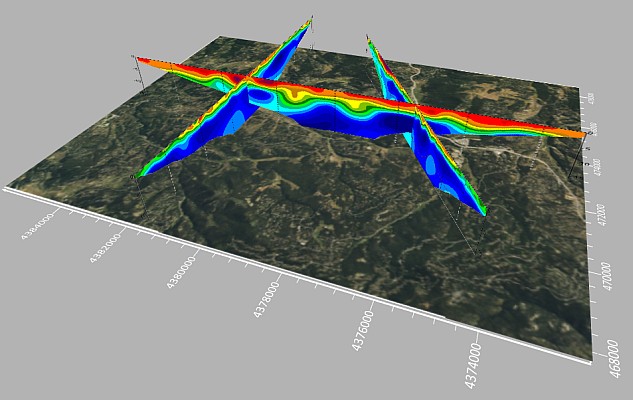
“The core ENVI software now has significant out-of-the-box functionality for 3D point-cloud visualization, derived terrain product generation (e.g. DEM), and LiDAR analytics such as viewshed line-of-sight calculation,” according to Adam O´Connor, ENVI and IDL Product Manager at Harris. “If you need point-cloud or terrain products in an area where collecting LiDAR is not feasible or is too expensive, the ENVI Photogrammetry Module is able to generate synthetic 3D point clouds from stereo optical imagery to take advantage of existing imagery archives,” added O´Connor.
We didn´t stop there – we enhanced the 4th dimension…time!
The dimension of time can be critical for a thorough geospatial analysis of an area and this ENVI release has added enhancements to the Spatio-Temporal analysis toolset. Spatio-Temporal analysis visualizes change and derives statistics from data over time. “Understanding these patterns is part of an ongoing strategy to provide our users with methods to observe events of the past to better predict upcoming activities,” said O´Connor. “This functionality helps organizations make better decisions as they plan for the future.”
New additions were also added to the ENVITask system, a relatively new method for performing discrete bits of image processing programmatically through the ENVI object-based API. This programmatic approach to image processing can save time because you can easily chain together multiple ENVITasks, allowing the output from one ENVITask to become the input to the next. There are now 138 ENVITasks available in the ENVI API. To learn more about what´s new in ENVI 5.3, be sure to attend one of the upcoming webinars.
EAS 2015 – The times they are a changin´
Last month leading minds in our industry gathered in Boulder, Colorado, for the ENVI Analytics Symposium (EAS). With world-class presenters and a high level and caliber of participation, the event exceeded expectations all the way around. Billed as the starting point for a community discussion on the future of the Geospatial Analytics Market, many opportunities and challenges were identified at EAS. Here are just a few of the takeaways from those two days.
All that talk of moving to cloud is happening now. Many presenters have deployed ENVI applications in a cloud or enterprise setting including Datamapper.com, CloudEO, DigitalGlobe´s Geospatial Big Data, and Hyspeedgeo.com to name a few. ENVI is consuming Esri image services in its cloud demonstration site. You can try it for yourself here. Consumers are looking for answers and these companies are providing them by solving problems through a cloud platform that can be accessed on demand and serve up actionable answers from a pile of data.
Big Data was on display at EAS
Speaking of data – yes, the volume is huge and growing all the time. DigitalGlobe is taking on Geospatial Big Data with its approach of “Platform as a Service” that provides data and compute power to “show me where” I can find features in a sea of data. Airbus Defense and Space has a World DEM at 12m resolution, enabling terrain modeling in areas which previously had only SRTM 90m data to work with — this dataset is huge. There are numerous scientists asking questions of big data and the compute power is there in force to do this and not just expensive super computers – a GPU can turn a laptop into a super computer if put to work the right way.
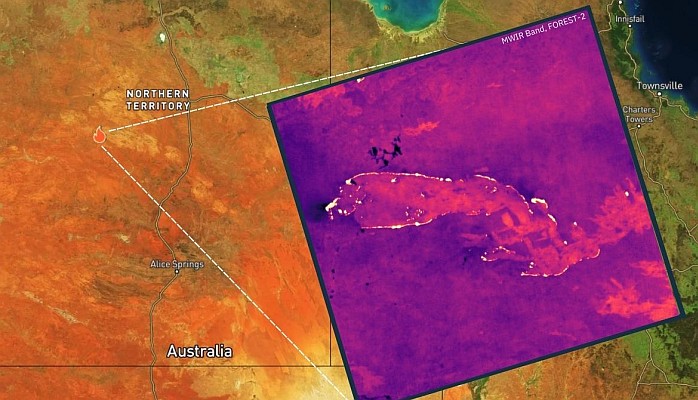
Another interesting takeaway from EAS was that spectral analysis is still coming up with new discoveries. There were presentations on WV3 and SWIR data, a how to on using thermal data to enhance HSI imagery for certain mineral mapping, and a demonstration of U.S. Geological Survey´s Processing Routines in IDL for Spectroscopic Measurements (PRISM) software (it´s free, so check it out).
For more highlights from #EAS2015 check out this recent Imagery Speaks blog post and watch the video highlight reel.
Source: GeoCommunity