Golden Software, a developer of affordable software for visualizing and analyzing diverse data sets, has released the newest version of its scientific graphing package, Grapher™. New capabilities significantly improve the user’s ability to model, analyze and interpret multiple data sets together.
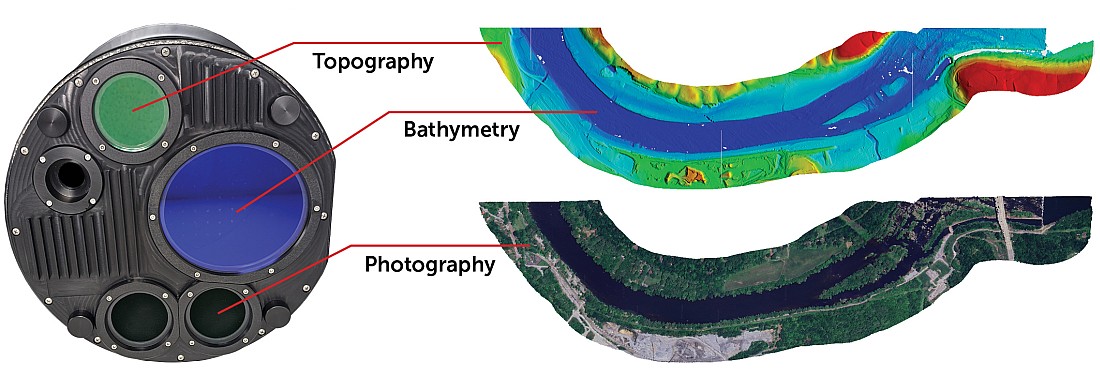
Grapher is used extensively by scientists and engineers in oil & gas operations, environmental consulting, climate research, mineral exploration, and academic pursuits. The package offers deeper insights into diverse data sets, including chemical, physical, geologic and geospatial data, through 80 different 2D and 3D plotting types.
“The enhancements and additions in the latest version of Grapher are designed to make it easier for users to tackle bigger scientific graphic projects – involving more data. New functionality enables users to create visually dynamic graphs that communicate results clearly and concisely”
said Leslie McWhirter, Grapher’s Technical Product Manager
The newest release of Grapher, which is downloadable this week to all users with active maintenance agreements, includes these enhancements:
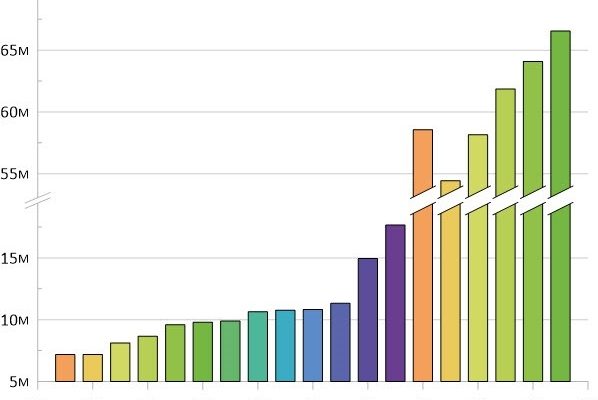
- Broken Axis Bar Charts – When displaying data with bar charts in which one or more bars has a significantly higher value than others, break the axis and the bars with a symbol or grid line to draw attention to the full range of data values.
- New Colormap Editor – Customize colormap gradients to adjust the colors and opacity, making it easier to emphasize a zone of significance in a plot.
- Color Gradients across Multiple Line Plots – Apply a colormap gradient across multiple line plots in a graph in order to quickly and easily differentiate them from one another.
- Grid Lines across Multiple Axes – To make correlations between plots easier to see, extend grid lines across two or more plots sharing common X or Y axes.
- New Legends and Color Scales – Add color scales to scatter plots colored with a colormap gradient, and legends to plots containing color tables or symbol tables, making for easier-to-understand graphics.
- Add Plot Titles –Label plots with the plot name in order to convey what the plot represents without having to add a legend.
- Print or Export Multiple Pages – From multi-page project files, print or export one, many, or all of those pages using a single time-saving operation.
- Enhanced File Share Functionality – Grapher Preview users can now save files that can automatically be opened into the latest Grapher release without having to save back to an older file format. Additionally, files created in any future version of Grapher or Grapher Preview can be opened in any version back to this version of Grapher.
Golden Software’s development team is already working on new features, functionality and enhancements for the next version of Grapher that will be released later this year. Users with active maintenance can take these new capabilities for a test drive by downloading the Grapher Preview. They are invited to send comments and/or questions directly to the Golden Software development team as they use the Preview version in their day-to-day workflows.
McWhirter adds:
“In this version of Grapher Preview, we are focused on making it easier for users to customize their graphs”
Specifically, newest Grapher Preview features include:
- New Notifications Pane gives Golden Software the ability to communicate updates and other news directly to users from inside the software package.
- 2D Class Scatter Plots can be created from existing 2D Scatter Plots with a single command.
- Legend Entry Sizes, such as line length or point size, can be set individually for each legend entry by the user.
- Add Plots to Existing Graphs from a complete list of plot types in the ribbon bar.
For additional information, visit www.GoldenSoftware.com.